For three weeks we wrote nothing in the changelog. Not because nothing happened, but because one big thing was happening, and it made no sense to note it in pieces.
Until June our calculator had four tabs: the Sun’s path across the sky, the obstacles around the house, the estimated yield, and the sizing of the panel strings. Each did its job well. But someone who wanted a whole project, from the house’s address to the papers you hand an electrician, had to jump from tab to tab and keep the rest in their head or in a spreadsheet. The calculator answered questions. It did not take you anywhere.
After finishing the course on designing a grid-connected photovoltaic system at the Technical University of Cluj-Napoca, taught by Professor Liviu Neamț - whom I greet on this occasion - I was left with its structure in my head. The course is built as a path: first where the house is and how the roof faces the Sun, then what shades it, then how much the people living in it consume, then which panels and which inverter fit, how the panels sit on the roof, how much they produce, how they are wired together, with what cables and what protections, what it costs and how long it takes to pay back. Every step uses what the step before it decided. Nothing is calculated twice.
We took that order and made it the spine of the program.
Every step became a page. The pages are strung in the course’s order, with a sidebar that shows where you are and what you have already ticked off. Underneath there is one project, saved in your browser, into which every page writes its part and from which the next page reads its starting values. Change the number of panels at step four and the yield at step six changes by itself, and the cable sizing further on starts from the new values. There is nothing left to copy from one tab to another.
Some pages already existed and only had to be put in their place. Others appeared then.
The consumption step, for one. A photovoltaic system is not sized by what fits on the roof but by what the house consumes. So the page lets you type the twelve monthly figures from your bills or, if you do not have them at hand, list the appliances in the house with their power and their hours a day, and let the program add it up. Out of the annual consumption comes a recommended size for the installation, which the components step takes as its target. In the same place we added a value many people discover only at the end: the maximum power approved for the grid connection, the limit the distributor gives you in the technical permit. If the recommended installation exceeds it, the page warns you then, not after you have bought the panels.
Then the module database. Until then the program knew three panels, and knew them roughly. We took the manufacturers’ datasheets and checked the figures one by one: a Jinko’s efficiency was 22.77%, not the rounded value we were computing; a Canadian Solar’s temperature coefficient was not what we thought; a link to one datasheet had led for two years to a page that no longer existed. Modules now have a page of their own, with every value, the link to the original document, and a button that sends them straight into a string of the project.
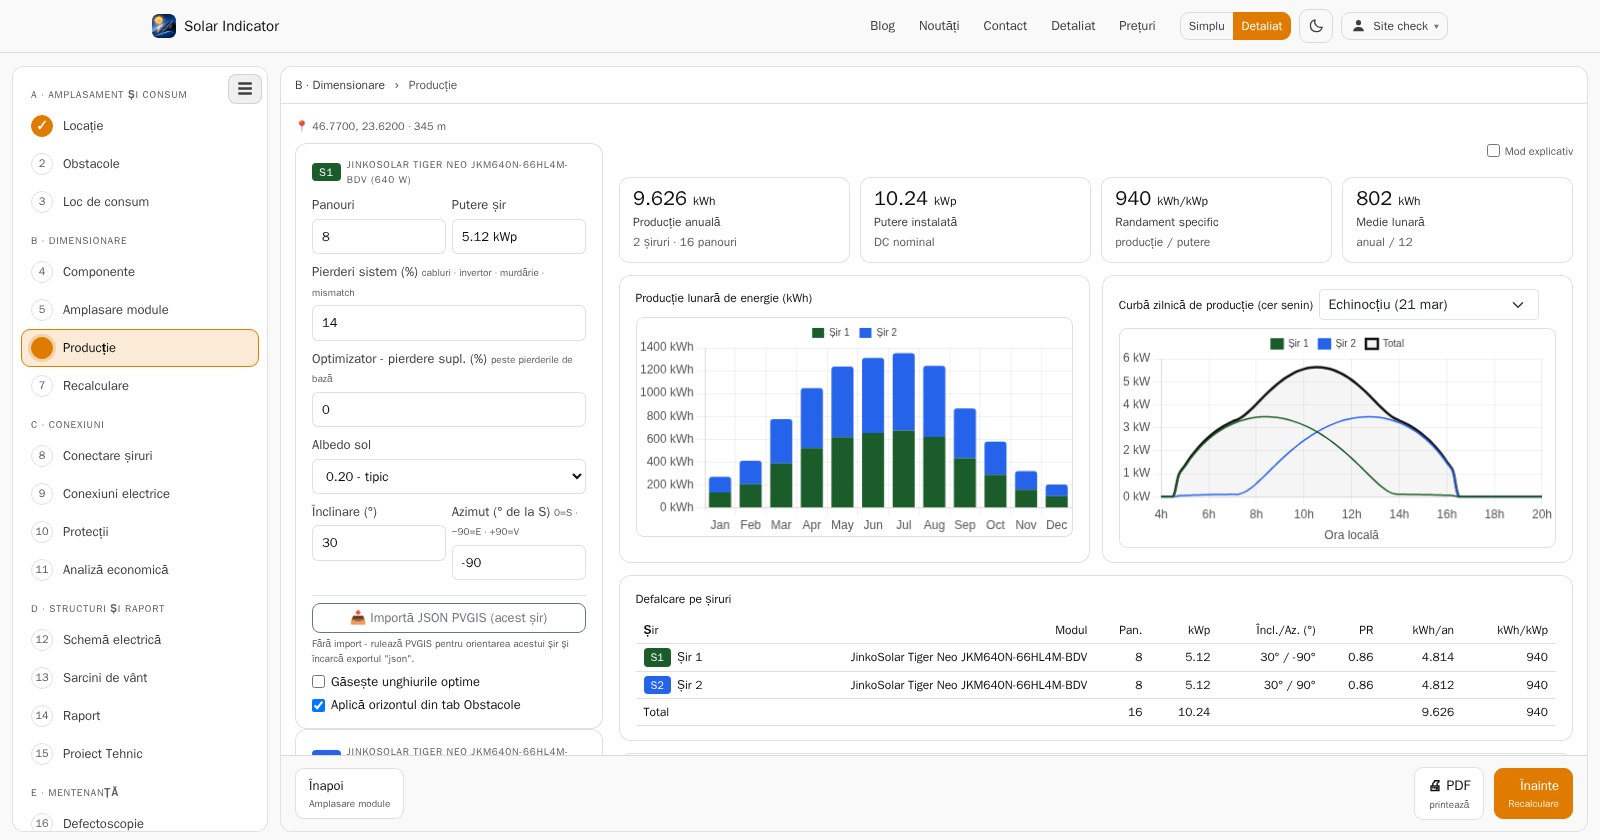
The mounting step draws the rows of panels to scale, with the spacing between them computed for the winter solstice, when the Sun is lowest and a row’s shadow reaches farthest. The yield step learned to work with several strings at once, each with its own orientation, which produced something we could not draw before: the daily curve of a roof with panels on two pitches, east and west, which has two humps instead of one, because half the panels catch the morning and the other half the afternoon.
And because the path is a Romanian one, the program now speaks Romanian first. English stayed, but moved to second place.
Not everything was ready on 8 June. The recalculation step, where you compare what you produce with what you consume and see how much you export and how much you import, still had to wait. So did the economic analysis, the technical project for the client and the battery database. But the structure was there: eleven of the eighteen steps we have today, in the order a designer walks them.
Until June, the calculator told you how much a roof produces. Since June, it takes you from the address all the way to the project.